
We used simulations to compare nephrotoxicity and target attainment between synthetic patients dosed using the Hartford Nomogram or model-informed precision dosing and stratified results for patients of different levels of renal function. Fixed-dose nomograms produced systematic supratherapeutic exposure; individualized dosing offered a clear, quantifiable benefit.
A Protocol from a Prior Era
Extended-interval aminoglycoside dosing has been standard practice for three decades, and the Hartford Nomogram remains the most widely implemented protocol. Its design is straightforward: a fixed 7 mg/kg starting dose with CrCl-based interval assignment (q24h, q36h, or q48h at cutoffs of 60 and 40 mL/min) and a single post-dose concentration checked against a boundary curve.
Designed for an era before clinical decision support software, it served its purpose. But it does not individualize the starting dose, uses a single PK parameter to stratify an inherently heterogeneous population, and incorporates therapeutic drug monitoring (TDM) only as a toxicity safety filter. Patients flagged by the boundary curve get an interval extension; patients who are underdosed get nothing.
Model-informed precision dosing (MIPD) works differently. Population PK models, MAP Bayesian estimation, and patient-specific covariates enable prospective dose individualization, with TDM used to refine estimates rather than screen for toxicity.
Here, we compare these two approaches for tobramycin and gentamicin.
Aminoglycoside Dosing Study Design and Methods
We used the mipdtrial R package to enroll 1,000 virtual patients per renal function stratum from NHANES 2015-2016 data. Three strata mirrored Hartford’s own interval thresholds: CrCl >=60, 40-59, and 20-39 mL/min.
In the real world, no popPK model is a perfect match. To incorporate model misspecification, we used different models for simulating “true” patient PK and for estimating patient PK during MIPD. For gentamicin, we used the model by Tong et al. for estimation and the model by Xuan et al. for simulation. For tobramycin, we used the model by Tong et al. for estimation and the model by Hennig et al. for simulation. MIC was fixed at 1 mg/L.
We evaluated four strategies:
- Hartford Nomogram – 7 mg/kg by actual body weight fixed dose, CrCl-based interval, no TDM
- Hartford+TDM – standard Hartford initial dosing with single post-dose level drawn 6-14 hours post-dose and interval adjustment per the boundary curve
- MIPD (initial dose only) – population PK model (Xuan or Hennig)informed starting dose individualized to patient covariates, no subsequent TDM
- MIPD+TDM (single random level) – model-informed (Xuan or Hennig) starting dose plus MAP Bayesian update from a single level drawn 6-14 hours post-dose
The primary endpoint was AUC24 target attainment (80-120 mg*h/L) selection as a slight alteration on the reported goal of AUC24 >80 mg*/L found by Hashiguchi et al. For the purposes of these simulations MIC was assumed to be 1 mg/L. We additionally ran a version targeting Cmax of 15-25 mg/L, with concentrations assessed 30 minutes after the end of infusion. Secondary endpoints included supratherapeutic exposure, trough distributions, estimated nephrotoxicity based on a trough-concentration fit logistic model as published by Rybak et al., and outcome risks expressed as NNT/NNH relative to each relevant comparator.
Why Hitting the Peak Target Isn't the Whole Story
When looking at the Cmax targeting group in Figures 1 & 2, it looks like an overall success on paper, especially in gentamicin. Across our simulated gentamicin cohorts, every strategy achieved a peak within 15 to 25 mg/L in 86 to 93% of patients, compared to AUC24 attainment of just 34 to 57%. Part of that gap is structural: the Cmax window is wide (roughly +/- 25% around a midpoint of 20 mg/L), and the peak is largely a function of dose and weight, the very inputs used to calculate the starting dose. For tobramycin, however, this advantage disappears for the Hartford-based approaches, where Cmax attainment fell to just 18 to 46%, and when viewing Figure 1 it is clear this is driven by supratherapeutic Cmax values.
More broadly, hitting a Cmax target says little about what happens at the trough, and a patient who clears the drug slowly can have an identical peak to one with brisk elimination but with greater risk of toxicity. The Hartford nomogram attempts to address this by using a single 6 to 14 hour post-dose level to select a dosing interval, but that coarse stratification cannot fully quantify the cumulative exposure that predicts harm. This parallels how vancomycin trough monitoring was eventually recognized as a poor surrogate for AUC/MIC, prompting the 2020 guideline shift to AUC-guided dosing. AUC integrates exposure across the full dosing interval and is less sensitive to the slight estimation differences that can cause Cmax predictions to vary substantially depending on which PK model is used.
Together, these properties make AUC24 a more robust target for individualized aminoglycoside dosing. Hence the majority of the findings will be framed through the reference targeting AUC24.
Key Findings: Where MIPD Outperformed the Hartford Nomogram
Systematic Supratherapeutic Exposure With the Hartford Nomogram
Across both drugs and all three renal function strata, Hartford Nomogram dosing produced the highest rates of supratherapeutic AUC24 exposure. This isn’t surprising: the 7 mg/kg dose was designed to err on the side of efficacy, and in an AUC-based framework this bias shows up more clearly, with more patients exceeding an AUC24 of 120 mg*h/L, systematically elevated troughs, and the highest probability of nephrotoxicity of any arm.
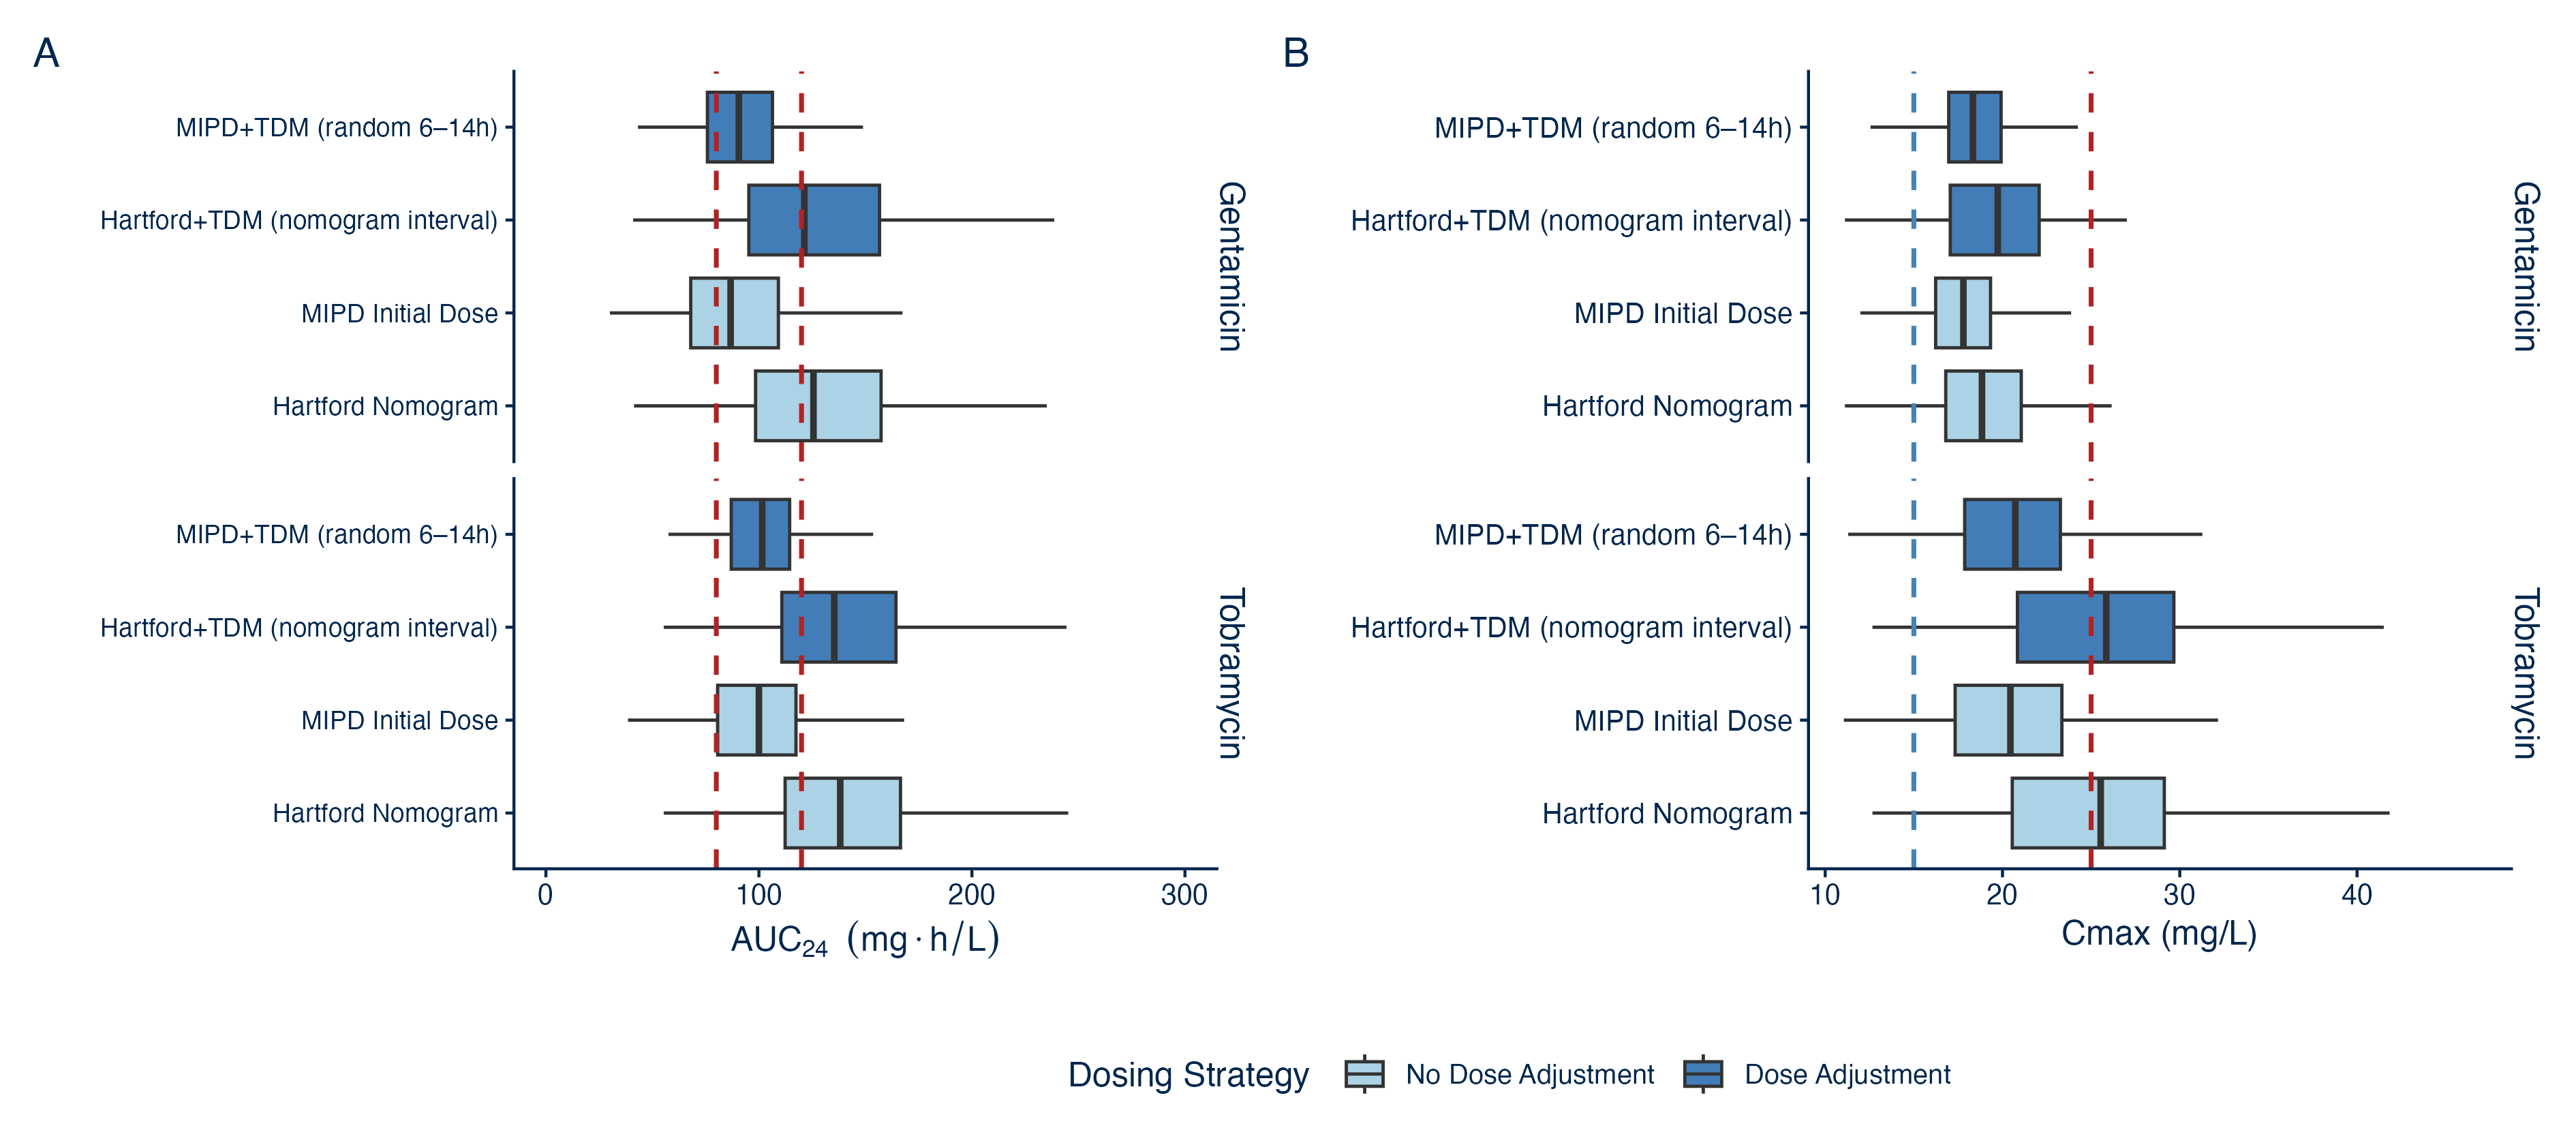
Figure 1: Target distributions (A) AUC24 and (B) Cmax by dosing strategy group.
MIPD Improves Target Attainment Before a Level Is Drawn
The most practically important finding: using a population PK model to individualize the starting dose, without any TDM, produced higher AUC24 target attainment than Hartford+TDM across most strata and both drugs.
The reason is straightforward. The Hartford nomogram’s TDM step adjusts only the interval, only upward, and only after exposure has occurred. The model-informed starting dose uses patient-level information at the time of prescribing to reduce inter-individual variability before any drug is given.
One tradeoff worth noting: compared to the Hartford approach, model-informed initial dose shifts the AUC distribution away from supratherapeutic exposure but slightly increases the proportion of patients below target. This is a deliberate safety property rather than a failure, and it still outperforms Hartford+TDM on overall target attainment, but institutions should be aware that underdosing rather than overdosing is the more likely initial miss prior to TDM. Additionally, this could also be counteracted if found consistent in a real-world clinical setting by selecting a slightly higher value in the target range, which would likely come with slightly higher supratherapeutic exposure in relation to the current model-informed starting dose finding. Either way, using a model helps a clinician make a more informed decision about the tradeoff with which they are more comfortable.
TDM Amplifies the Benefit
Adding a single post-dose level via MAP Bayesian estimation pushes the advantage further.
MIPD+TDM with a single randomly-timed level produced the highest AUC target attainment of any single-level strategy. For less than every 10 patients dose using MIPD+TDM, one more patient would have a therapeutic AUC24 compared to the Hartford+TDM approach.
Both MIPD strategies reduced modelled nephrotoxicity risk relative to their respective Hartford comparator: MIPD Initial Dose vs. the Hartford Nomogram, and MIPD+TDM vs. Hartford+TDM. The mechanism is the same in both cases: removing the systematic upward bias of the 7 mg/kg starting dose keeps troughs lower, reducing nephrotoxicity risk.
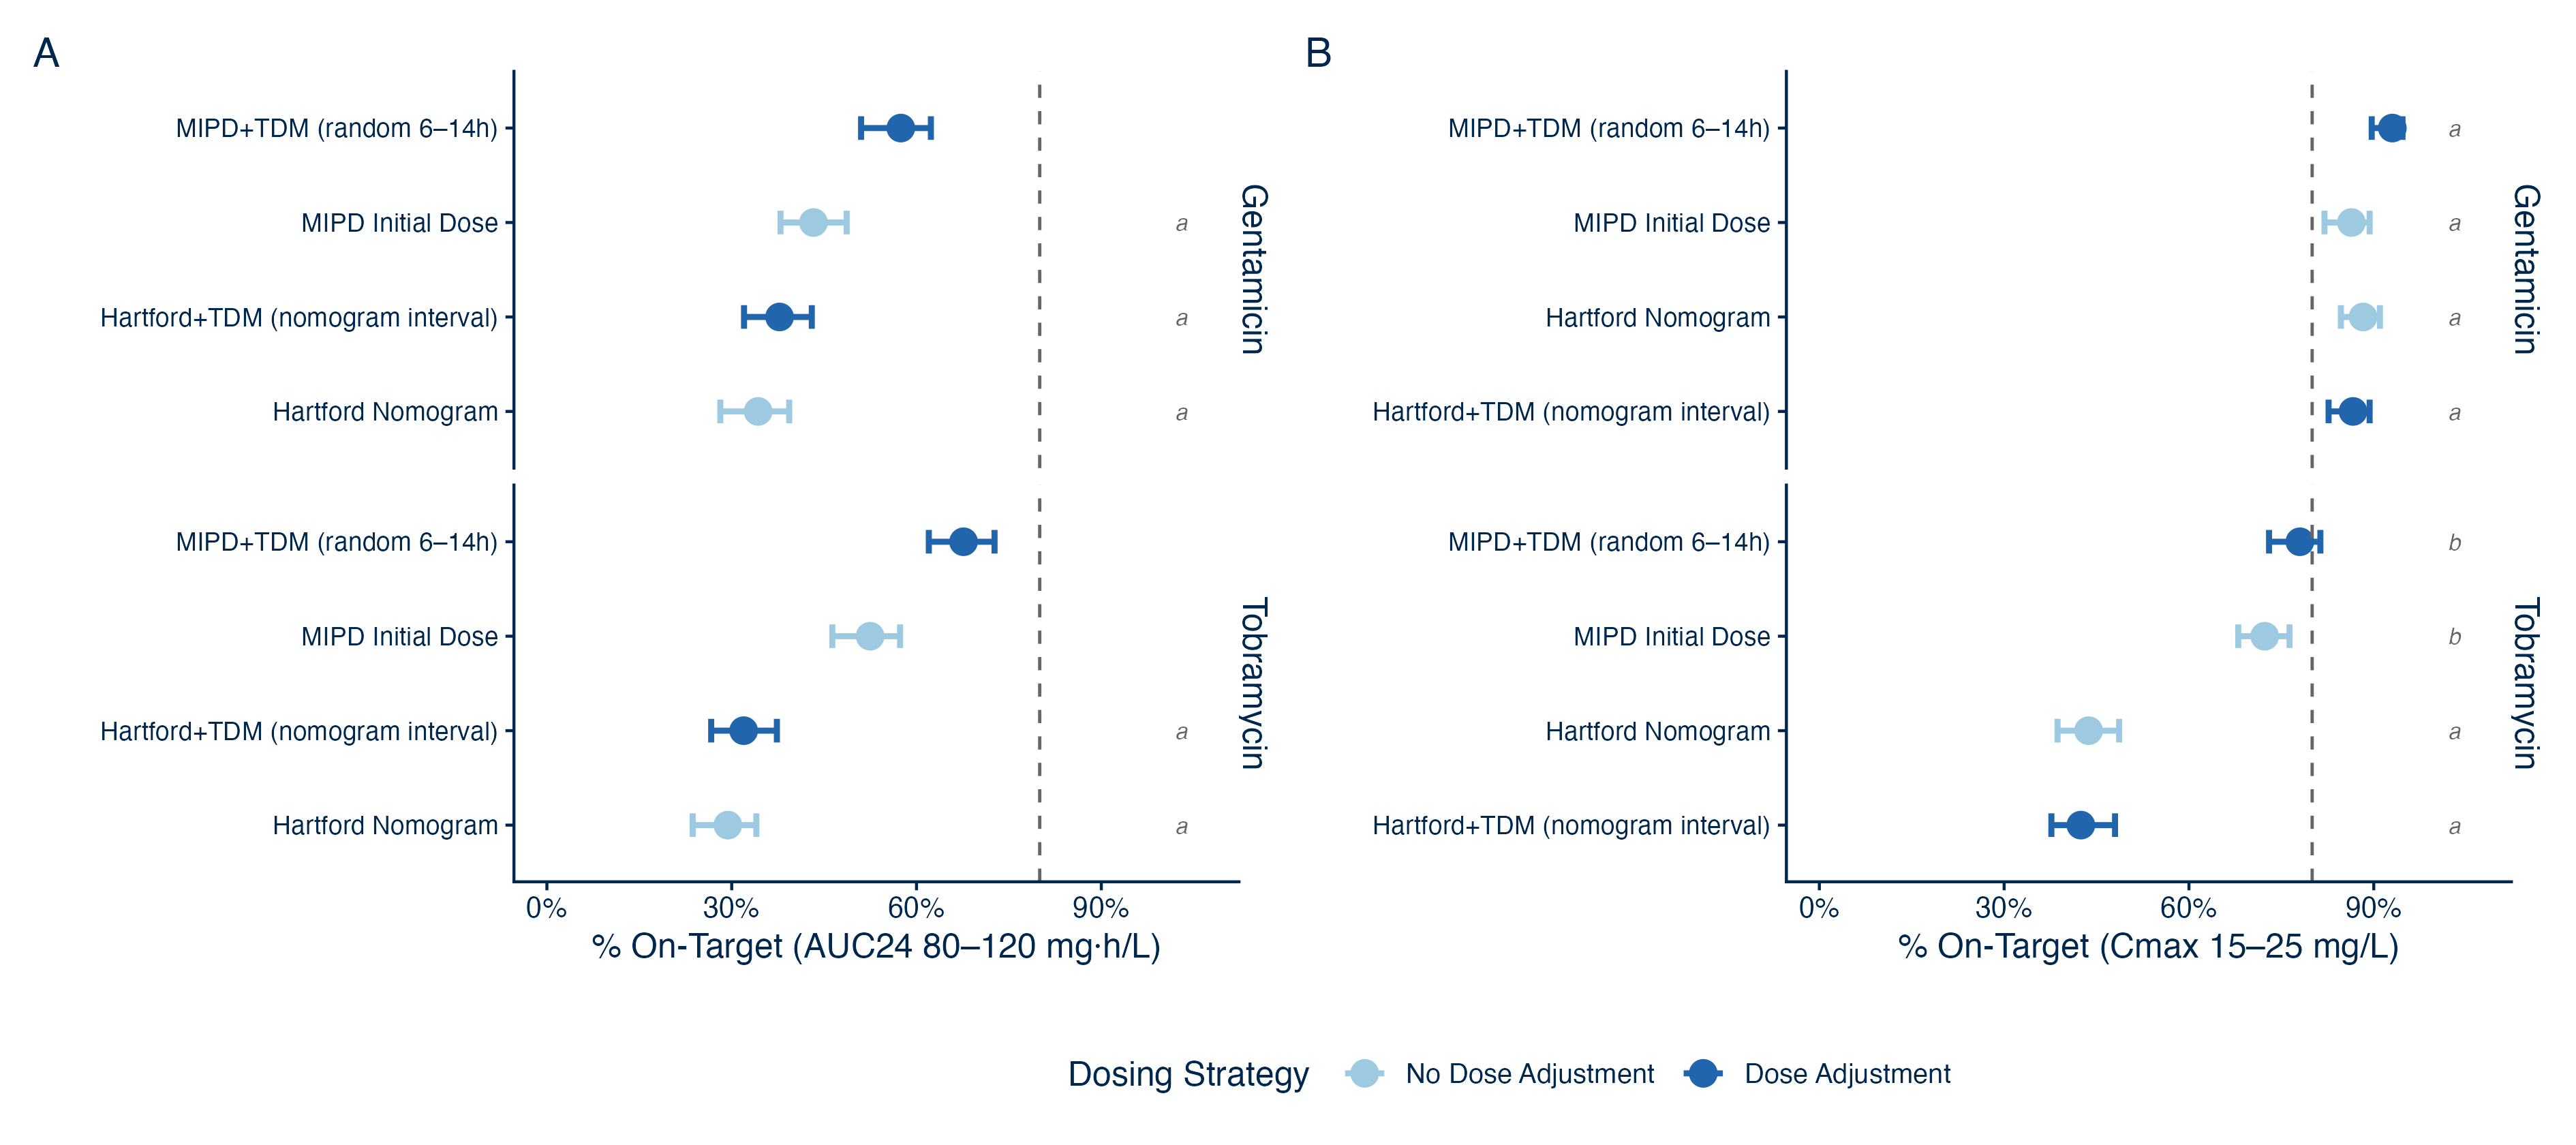
Figure 2 (above): Target attainment (A) AUC24 and (B) Cmax by dosing strategy, where ‘a’ and ‘b’ denote groups that have estimates with overlapping bootstrap 95% CI.
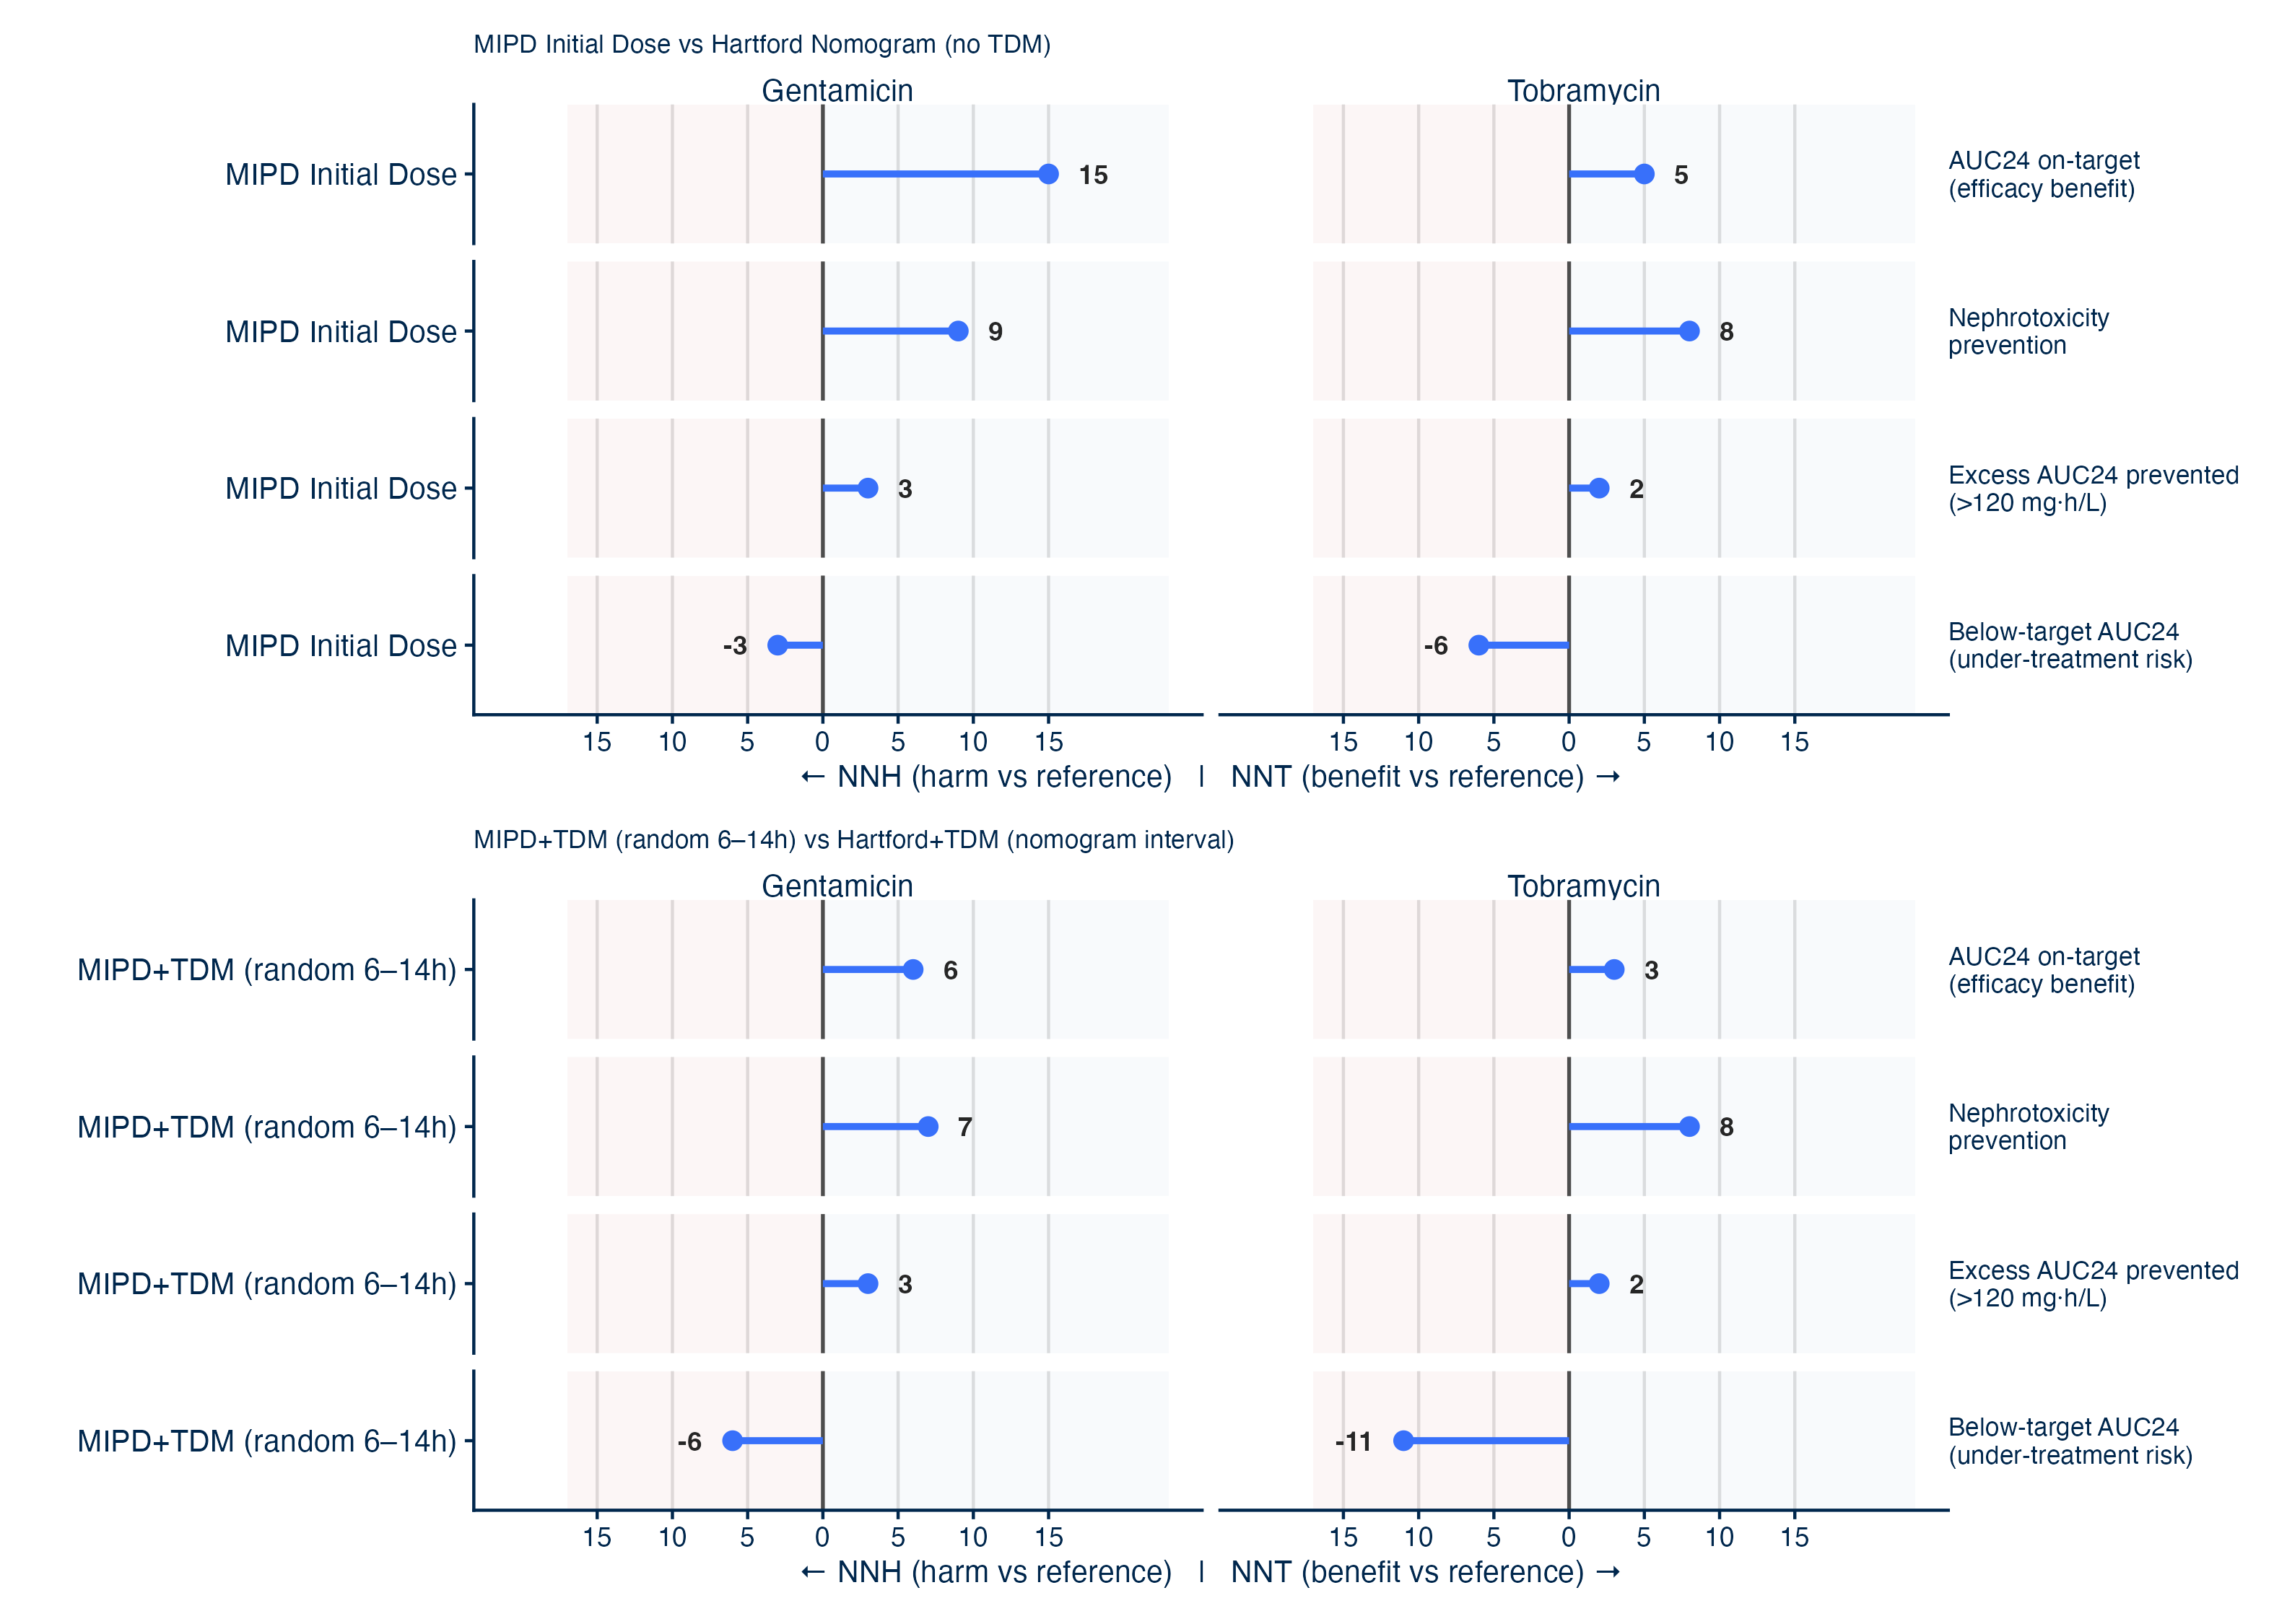
Figure 3 (above): NNT/NNH: MIPD vs Hartford Nomogram strategies. (Top) Initial dose selection only, (Bottom) dose adaptations in both groups (dose amount for MIPD+TDM vs dose interval for standard Hartford Nomogram).
Clinical Implications for Aminoglycoside Dosing Programs
The results told a consistent story across both drugs and all renal function strata:
- MIPD+TDM (single random level) – NNT below 10 vs. Hartford+TDM; substantial improvement across strata
- MIPD initial dose only – outperforms Hartford+TDM without requiring a post-dose level across strata
- Hartford+TDM – lower nephrotoxicity compared to the Hartford nomogram without TDM, but systematically overexposes patients to the drug
- Hartford Nomogram (no TDM) – highest supratherapeutic exposure, highest nephrotoxicity risk across all strata
For institutions that have not yet implemented full MIPD workflows, this finding offers a practical entry point. Model-based initial dosing requires only routine patient information and no modified sampling protocols.
InsightRX Nova helps clinicians implement MIPD or the Hartford nomogram, with seamless EHR integration. However, because of these results, we recommend users implement MIPD at their institutions. While the process of adding a single post-dose concentration for assessment is the same for both Bayesian updating and Hartford TDM protocols, these levels provide more insight into a patient’s PK when interpreted using Bayesian statistics compared to Hartford Nomogram’s binary toxicity check.
Limitations
Simulation Study – as a simulation study, these results cannot replace clinical evidence. Prospective clinical studies are needed to confirm whether MIPD’s advantage translates to better target attainment and outcomes in real-world practice.
Single TDM sample and single dose adjustment – TDM-guided arms simulate one concentration and one dose adjustment per course. Increasing sampling density or allowing iterative TDM cycles would be expected to further improve attainment.
Interval not individually optimized – dosing intervals used CrCl-based thresholds identical to the Hartford protocol. True MIPD could individualize both dose and interval, which would be expected to improve attainment beyond what is shown here.
Constant renal function – simulated patients had fixed renal function throughout their course. In clinical practice, renal function fluctuates, and patients without TDM-guided dose adaptation likely have inflated performance in this model relative to real-world outcomes.